
Constructing trendlines
A rising trendline may connect successive swing lows; a falling trendline may connect swing highs. Use consistent anchor rules and avoid redrawing a line only to fit a preferred narrative.
Price channels
A channel uses roughly parallel boundaries around a trend or range. Price may respect, overshoot or break the boundaries.
Breaks and retests
A line break is an observation, not an automatic order. False breaks, gaps and rapid reversals occur; seek context from structure and volatility.
Combining tools
Use trendlines as visual aids alongside swings, zones, sessions and risk limits. More indicators do not automatically mean more reliable analysis.
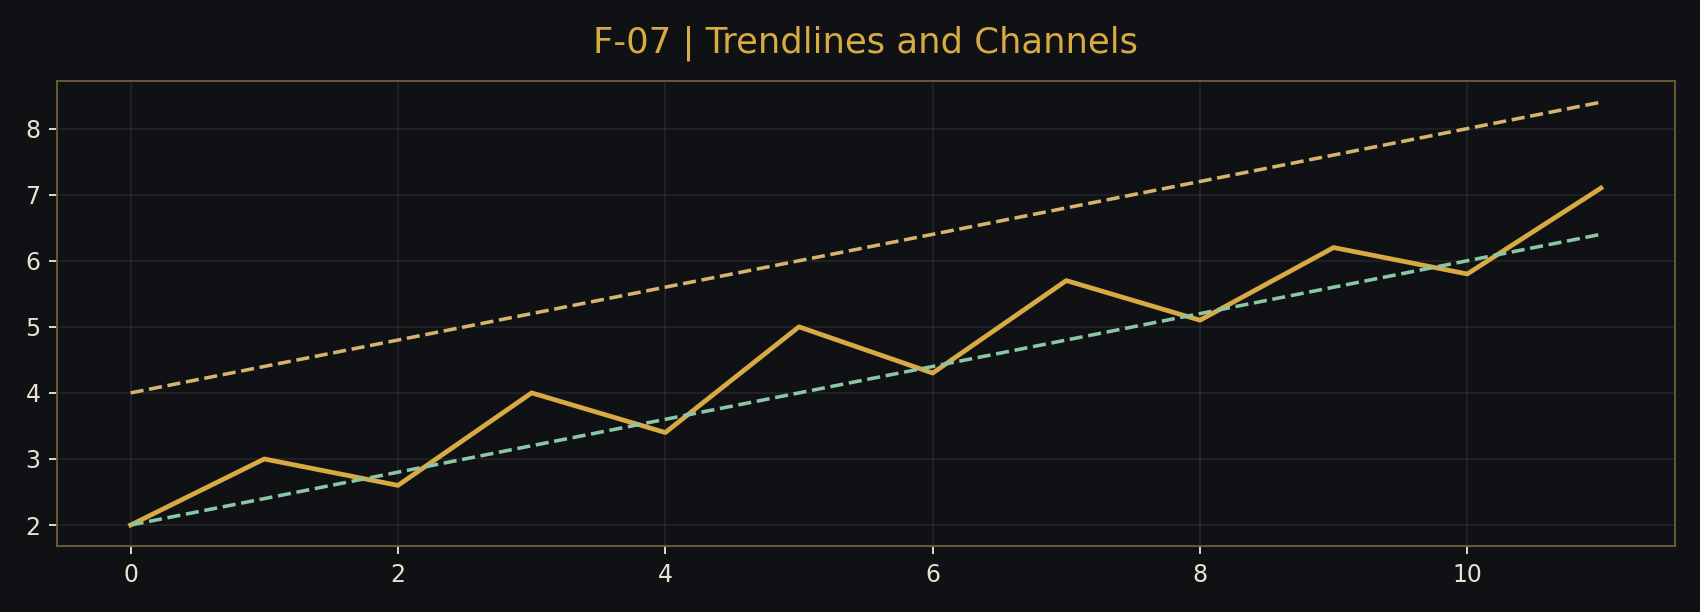
Worked example
An illustrative rising line through lows at 50 and 55 may project an area near a later swing; a later break does not prove a downtrend.
Try it yourself
Draw one rising line, one falling line and one channel on historical charts; explain each anchor.
Independent activity
Compare two alternative valid trendline placements and write how the conclusion changes.
For your own learning. No upload, submission or approval is required. Use demo or historical practice only.
Download journalKey terms to review
Trendline, Channel, Retest, False breakout
Check your understanding
Answer all five questions, then check the explanations. Retry as often as you wish.
Choose one answer per question, then check your answers. You can retry; scores are not saved.
Suggested review target: 4 of 5.
Four out of five is a suggested review target. You can open any lesson regardless of your score.