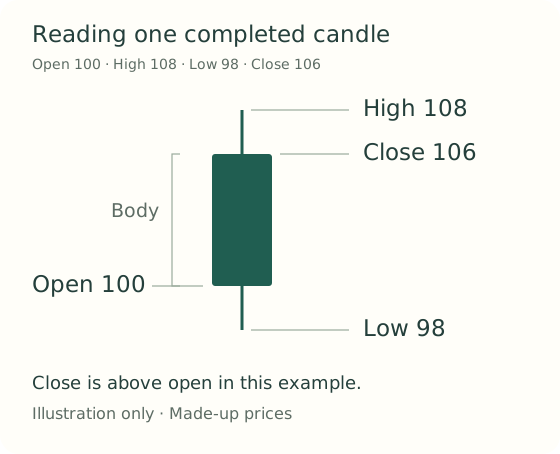
Each candlestick summarises four prices during a chosen interval:
| Price | Meaning |
|---|---|
| Open | The first price. |
| High | The highest price. |
| Low | The lowest price. |
| Close | The final price. |
The candle’s body shows the distance between open and close. Its wicks show the extremes. Candle colours depend on your platform settings.
An unfinished candle changes as new prices arrive. Wait until its interval closes before treating its final shape as confirmed.
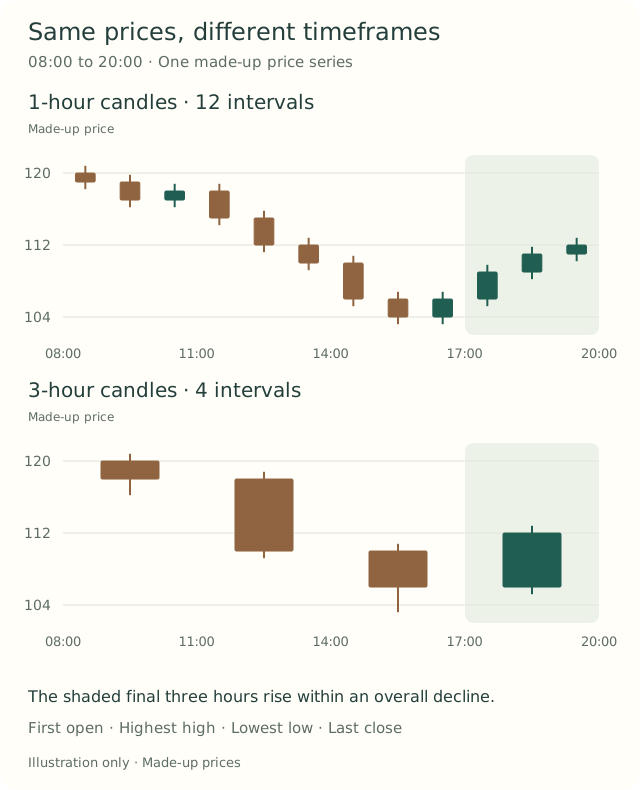
Timeframes group price observations into different intervals. On a one-hour chart, each candle represents one hour. On a daily chart, each candle represents one day.
A short-term rise can occur within a broader decline. Different timeframes provide different context; neither guarantees the next price movement.
Practical exercise
Open a demo chart and examine ten completed candles.
- Record the instrument and timeframe.
- Identify the open, high, low, and close of one candle.
- Compare the same instrument on two timeframes.
- Describe what changes and what remains uncertain.
Knowledge check
Write your answers in your learning journal before checking the answer key.
1. What does OHLC mean?
- A. Open, high, low, close.
- B. Order, hedge, limit, cost.
- C. A trading strategy.
2. What do candle wicks show?
- A. Guaranteed reversals.
- B. The interval’s price extremes.
- C. Future prices.
3. Can an unfinished candle change?
- A. No.
- B. Only its colour.
- C. Yes.
4. Can a short-term rise occur within a broader decline?
- A. Yes.
- B. Never.
- C. Only because of a platform error.
5. Does a timeframe alone provide a guaranteed entry signal?
- A. Yes.
- B. No.
- C. Only on daily charts.
Reveal the answer key
- A — These are the four prices summarised by a candle.
- B — Wicks record the observed extremes.
- C — New prices update the candle until it closes.
- A — Different timeframes can show different context.
- B — A timeframe groups data; it does not guarantee outcomes.